
HR Analytics with R - Hero Section
HR Analytics Masterclass

Master HR Analytics With
R Programming

Transform raw data into predictive models. Learn data modeling, multiple regression, logistic regression, and advanced analytics to make data-driven decisions that drive HR strategy.

Enroll in Next Batch

18 Core Modules

Master Data Transformations

Live Dashboards

Publish Interactive HR Reports

Zero Coding Exp. Needed

Start from your first line of R

Get The Syllabus

Enter your details to instantly download the complete HR Analytics with R Syllabus PDF.

HR Analytics with R - Curriculum
18 Modules • 16 Weeks

World-Class Syllabus

A comprehensive journey from writing your first line of R code to deploying predictive HR models and executive dashboards.

Phase 1: Modules 1-3

R Programming Foundations

  • Introduction to R & RStudio Variables, functions, data frames, and R toolkit setup.
  • Data Management in R Importing data (Excel, HRIS), cleaning messy text, using dplyr & joins.
  • Exploration & Visualization Detecting outliers, distributions, and building stunning charts with ggplot2.
Phase 2: Modules 4-6

Core Predictive HR Analytics

  • HR Intervention Testing Pre/post scores, t-tests, and proving the ROI of HR programs.
  • Employee Engagement Analytics Survey data transformation, correlation, and multiple linear regression.
  • Employee Turnover Modeling Logistic regression, risk scoring (AUC/ROC), and attrition predictions.
Phase 3: Modules 7-16

HR Sub-Domain Analytics Labs

  • Talent & Performance (TA, L&D, PMS) Hiring funnels, training ROI (Kirkpatrick), rating biases, 9-box grids.
  • Comp, Payroll & HR Ops Anomaly detection, gender pay gaps, ticket SLAs, forecasting.
  • Risk, Compliance & Audit Statutory reconciliations, POSH reporting, HR auditing with sampling.
Phase 4: Modules 17-18

Dashboards & Capstone Project

  • Interactive Dashboards & Storytelling Building web apps with Shiny/flexdashboard, data privacy & ethics.
  • 100% Practical Capstone Project Solve a multi-domain HR problem using a synthetic master dataset. Produce a deployed dashboard and presentation.
HR Analytics with R - Curriculum Section
70+ Hours • 16-Week Roadmap

Structured Learning Path

From installing RStudio to running predictive retention models and deploying interactive Shiny dashboards.

Phase 1 Modules 1 – 3

R Programming & Data Foundations

  • 01

    Intro to R & RStudio Setup

    Console navigation, vectors, data frames, syntax, functions, and packages.

  • 02

    Data Cleaning & Transformation (dplyr)

    Import CSV/Excel/HRIS, handle missing data, dates with lubridate, joins & filters.

  • 03

    Exploration & Visualization (ggplot2)

    Grammar of graphics, distribution plots, boxplots, facets, and demographic profiling.

Phase 2 Modules 4 – 6

Core Statistical & Predictive Analytics

  • 04

    HR Intervention & Impact Evaluation

    Pre/post training evaluation, paired t-tests, Cohen’s d effect sizes, control groups.

  • 05

    Employee Engagement Analytics

    Likert scales, Cronbach’s alpha, correlation matrix, multiple linear regression.

  • 06

    Employee Turnover & Attrition Modeling

    Logistic regression (glm), odds ratios, ROC/AUC validation, risk-scoring.

Phase 3 Modules 7 – 16

HR Sub-Domain Analytics Labs

  • 07

    Talent Acquisition & L&D Analytics

    Recruitment funnel drop-offs, offer-decline odds, ANOVA for training ROI.

  • 08

    PMS, Payroll & Compensation Equity

    Leniency bias, 9-box grid, payroll anomaly detection, adjusted gender pay gaps.

  • 09

    Audit, Compliance, POSH & Operations

    Sampling in audits, statutory reconciliations, confidential POSH timelines, ticket SLAs.

Phase 4 Modules 17 – 18

Dashboards, Ethics & Capstone

  • 10

    Shiny & flexdashboard Development

    Interactive web apps, filters, executive storytelling, data privacy (DPDP Act).

  • 11

    End-to-End Capstone Project

    Choose between Retention, Pay Equity, Talent Lifecycle, or Risk & Governance tracks.

  • 12

    Executive Presentation & GitHub Portfolio

    Build a documented, reproducible code repository to showcase to recruiters.

HR Analytics with R - Key Features
Built For Real HR Impact

Why Master People Analytics in R?

Go beyond basic pivot tables. Discover how R empowers modern HR professionals to predict trends and lead executive decisions with data.

Predictive Retention Models

Build real logistic regression models to compute attrition odds ratios, calculate ROC/AUC curves, and intervene before top talent exits.

Logistic Regression & glm

10+ HR Sub-Domain Labs

Direct applications across Talent Acquisition, L&D, PMS 9-Box, Payroll reconciliation, POSH timelines, and Labour Compliance registers.

True End-to-End HR Coverage

Interactive Shiny Dashboards

Design interactive web dashboards with Shiny & flexdashboard. Add department filters, drill-downs, and publish without paid software licenses.

No Paid BI License Required

Statistically Sound HR Tests

Learn when to run paired t-tests for training evaluation, ANOVA for manager ratings, and Cronbach's alpha for employee engagement reliability.

Avoid False Assumptions

Ethics & DPDP Act Compliance

Master data masking, anonymisation, bias auditing, and ethical handling of sensitive workforce records to ensure full legal privacy compliance.

Responsible People Analytics

Ready-to-Show GitHub Portfolio

Graduate with documented, reproducible Quarto scripts and a capstone presentation ready to showcase in senior People Analytics job interviews.

Real Proof of Work
HR Analytics with R - Tech Stack
Complete Technology Stack

Tools & Packages You Will Master

Learn the exact data science packages used by world-class People Analytics teams to automate, analyze, and build web apps.

R

RStudio / Posit

Primary IDE

Your interactive development environment for running scripts, managing projects, and building data pipelines.

dy

tidyverse (dplyr)

Data Wrangling

The core standard for data manipulation: clean messy exports, filter cohorts, group data, and join disparate HR systems.

gg

ggplot2

Data Visualization

Publication-quality graphics: plot workforce distributions, attrition boxplots, faceted charts, and demographic heatmaps.

sh

R Shiny

Interactive Apps

Turn analyses into interactive web applications with dynamic filters, reactive tables, and automated executive views.

ml

caret & glm

Machine Learning

Train predictive logistic models, evaluate turnover risk, and calculate precision with cross-validated ROC/AUC metrics.

dt

lubridate & janitor

HR Data Cleaning

Effortlessly parse messy attendance dates, calculate precise employee tenure, and standardize inconsistent column names.

db

flexdashboard

Executive KPI Views

Create sleek, markdown-based dashboard scorecards featuring KPI value boxes and departmental breakdown tabs.

qu

Quarto & Git

Reporting & Portfolio

Author reproducible executive PDF/HTML reports and publish your complete people analytics code portfolio to GitHub.

Zero Software Cost

Every tool and library taught in this course is 100% open-source and free for enterprise usage.

HR Analytics with R - Who Should Attend
Target Audience & Prerequisites

Is This Course Right For You?

Designed specifically for HR professionals looking to transition from manual reporting into high-impact, data-driven people decisions.

HR Generalists & HR Business Partners (HRBPs)

Move beyond Excel lookups. Predict attrition patterns, benchmark headcount, and advise business leaders with statistical rigor.

Talent Acquisition & L&D Specialists

Optimize hiring funnels, predict offer declines, evaluate training effectiveness with ANOVA, and measure Kirkpatrick Level 2 & 4 ROI.

Payroll, Comp & Benefits, and HR Auditors

Perform Benford's law anomaly audits, model market compensation lines, and analyze adjusted gender pay gaps with regression.

MBA / PGDM (HR) Students & Career Switchers

Build a competitive, recruiter-ready People Analytics portfolio with GitHub repositories, Quarto reports, and live Shiny apps.

Course Prerequisites

Everything you need before starting your journey in R.

  • Basic HR Understanding

    Familiarity with common HR terms like headcount, turnover, appraisals, and leaves.

  • Comfort With Excel

    Basic comfort with rows, columns, and viewing tabular data in spreadsheets.

  • Laptop with Internet

    Standard Windows, Mac, or Linux laptop capable of running free RStudio Desktop or Posit Cloud.

Zero Coding Required: You will write your very first line of R in Module 1 and build confidence step-by-step.

HR Analytics with R - Trainer Profile
Learn From An Industry Pioneer

Meet Your Master Instructor

Learn directly from a veteran People Analytics practitioner and corporate HR leader with extensive enterprise experience.

Mohammad Kashif - HR Analytics Trainer

Mohammad Kashif

Principal People Analytics & HR Consultant

Industry Verified Lead Trainer

Master Practical People Analytics, Not Just Syntax

Mohammad Kashif is a renowned People Analytics expert and corporate trainer with extensive experience consulting top MNCs, government bodies, and institutions. He specializes in bridging the gap between raw statistical programming in R and strategic HR decision-making.

Under his guidance, thousands of HR generalists, recruiters, and managers have transitioned from manual spreadsheet reporting into high-impact People Analysts capable of running predictive attrition models and building interactive web dashboards.

12+

Years Experience

1,500+

HRs Trained

100%

Practical Labs

Predictive Attrition (R) R Shiny Dashboards Compensation Equity tidyverse & ggplot2 HR Audit & Compliance
HR Analytics with R - Training Glimpses
Our Legacy & Trust

Trusted By Top Institutions & Corporations

Delivering high-impact People Analytics, Data Science, and Executive HR training to India's leading Universities, Armed Forces, and Fortune 500 organizations.
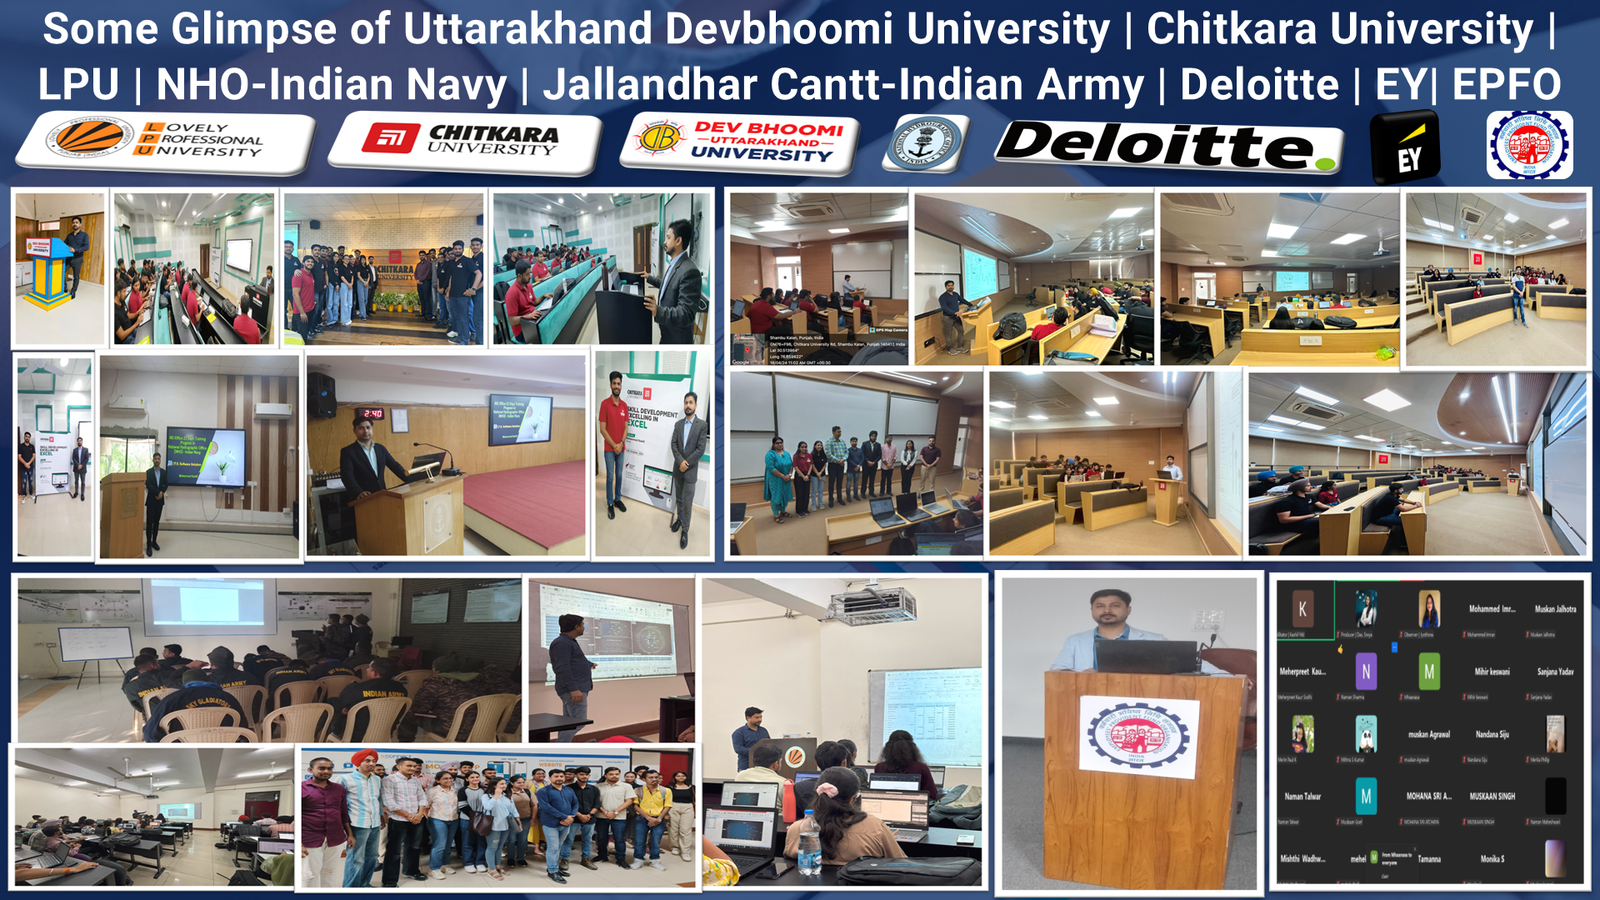
IMHR Academy Training Glimpses
HR Analytics with R - Certificate
Official Recognition

Earn Your Industry-Recognized Certificate

Validate your predictive People Analytics expertise with a verifiable credential that adds serious credibility to your resume.

Showcase Verified Proof of Work to Employers

Unlike basic participation slips, this certificate is awarded strictly upon completing the 18 modules, practical lab assignments, and the final Capstone Project. It proves your practical proficiency in R programming, predictive statistics, and executive dashboarding.

  • LinkedIn 1-Click Shareable

    Easily attach your credential to your LinkedIn profile under the "Licenses & Certifications" section.

  • QR Code & Unique Verification ID

    Employers and recruiters can instantly verify the authenticity of your credential online 24/7.

  • Backed by Real Capstone Projects

    Validates that you have solved end-to-end corporate workforce problems using R, dplyr, and Shiny.
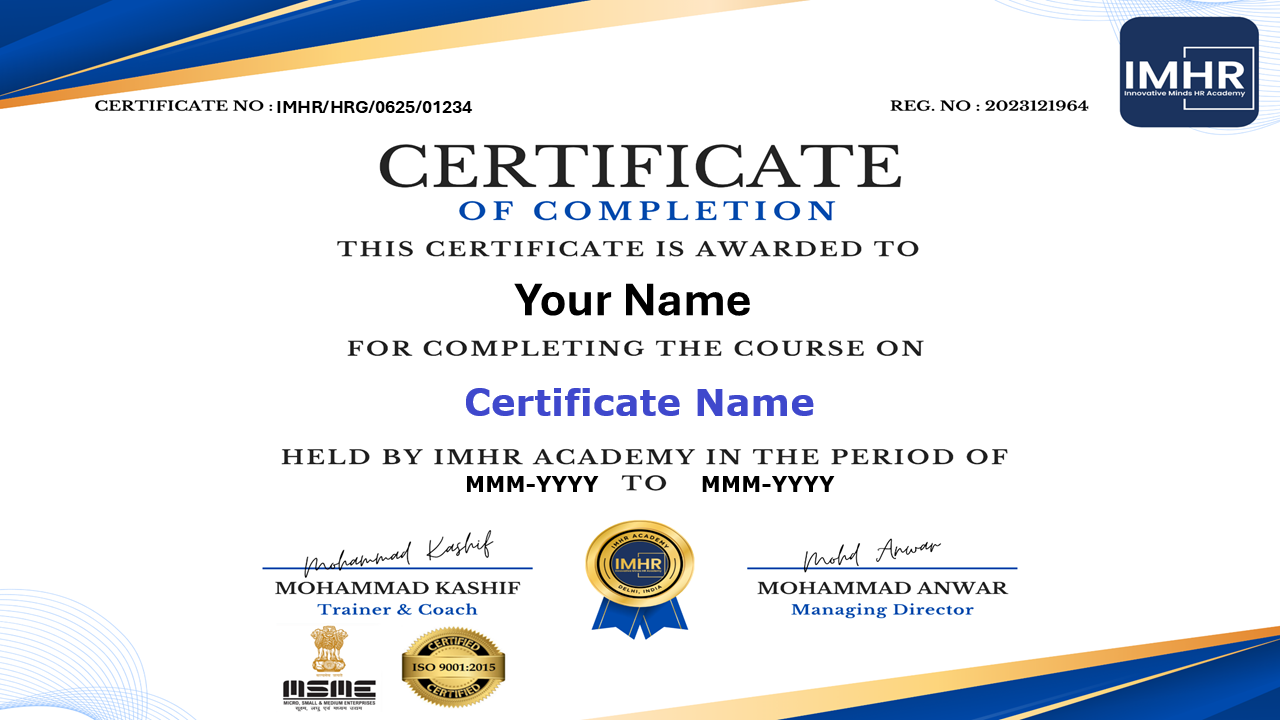
Enroll & Get Certified
IMHR Academy Official HR Analytics Certificate
``` Aap ise Elementor me replace kar lijiye. Ab aapka actual **IMHR Academy 2026 Certificate** right side par golden-tinted frame ke sath display hoga!
HR Analytics with R - Testimonials
Alumni Experiences

Trusted by HR Leaders & Analysts

See how our alumni transformed their workforce analytics capabilities and automated core HR processes.

"I had zero coding experience and was terrified of R. But Module 1 started so gently that within 4 weeks I was running multiple regression on our engagement survey. Game-changing curriculum!"

P

Pooja Mehta

Senior HRBP, IT Services

"Building an attrition risk prediction model with logistic regression helped our team identify flight-risk employees 3 months before appraisal. My CHRO was genuinely impressed with the insights."

R

Rohan Kulkarni

Talent Analytics Lead

"The R Shiny module is unbeatable. We created an internal attrition and hiring dashboard without spending any budget on Power BI Pro licenses. Truly enterprise-grade skills."

S

Sneha Nair

HR Operations Manager

"The sub-domain labs for Payroll anomaly detection (Benford's Law) and Gender Pay Gap adjusted regressions gave me practical scripts that I use every month now."

A

Anand Verma

Comp & Benefits Specialist

"I had zero coding experience and was terrified of R. But Module 1 started so gently that within 4 weeks I was running multiple regression on our engagement survey. Game-changing curriculum!"

P

Pooja Mehta

Senior HRBP, IT Services

"Building an attrition risk prediction model with logistic regression helped our team identify flight-risk employees 3 months before appraisal. My CHRO was genuinely impressed with the insights."

R

Rohan Kulkarni

Talent Analytics Lead

HR Analytics with R - Pricing
Limited Batch Seats Available

Enroll in HR Analytics with R

Master predictive people analytics, build real machine learning models, and graduate with a portfolio.

Everything Included in Your Enrollment:

  • 18 Comprehensive Modules (16 Weeks / 70+ Hours)
  • 10+ HR Sub-Domain Analytics Labs (TA, L&D, PMS, POSH)
  • Full-Stack Stack: RStudio, tidyverse, ggplot2 & Shiny
  • Synthetic Master Datasets & Reproducible Code Templates
  • End-to-End Capstone Project & Verifiable Certificate

🎁 Bonus: Ready-to-use HR Analytics GitHub Portfolio Templates

₹30,000 Save 50%

₹14,999

One-Time Complete Course Fee

Or ₹8,000 in Two Easy Installments
Enroll Now via WhatsApp
100% Practical • Live Interactive Sessions
HR Analytics with R - FAQs
Got Questions?

Frequently Asked Questions

Clear answers to help you understand how this program works and what you will achieve.

Do I need prior coding or programming experience?

+
Not at all. The entire course is designed specifically for HR generalists, HRBPs, and professionals with zero programming background. Module 1 walks you through installing RStudio, understanding simple syntax, and writing your very first lines of R code step-by-step.

Why should I learn R instead of Python or Excel?

+
While Excel is great for basic tallies, it struggles with large datasets, statistical tests, and predictive modeling. R was built by statisticians for data analysis, making it the preferred choice for people science, survey psychometrics (Cronbach's alpha), ANOVA for appraisals, and building interactive web dashboards with Shiny without paying expensive Power BI licenses.

Will we use real employee data in the sessions?

+
No, in compliance with ethical guidelines and India's Digital Personal Data Protection (DPDP) Act 2023, we never use live confidential workforce data with Aadhaar/PAN or bank accounts. We provide robust, realistic synthetic datasets (such as a 1,480-row HR Analytics employee dataset) that replicate genuine corporate HR challenges.

What will I build in the Capstone Project (Module 18)?

+
You will choose one of four specialization tracks: Retention & Engagement, Pay Equity & Payroll Audit, Talent Lifecycle (TA/L&D/PMS), or Risk & POSH Compliance. You will build an end-to-end reproducible R script, an interactive Shiny dashboard, and an executive Quarto presentation to showcase to employers.

What happens if I miss a live class?

+
Every live session is recorded and uploaded to your student portal along with the lesson R scripts, lab datasets, and assignment solutions. You also get lifetime access to our trainer support group for doubt clearance.
HR Analytics with R - Final CTA
Transform Your HR Career

Ready to Become a Data-Driven HR Leader?

Stop getting stuck in manual spreadsheets. Master R, build predictive retention models, and create interactive people analytics dashboards in just 16 weeks.

100% Practical • Hands-On Capstone Project • Verifiable Certificate
Scroll to Top