
Master Data Analytics With
R Programming
Transform complex datasets into actionable business intelligence. Learn data wrangling with tidyverse, publication-ready visualization with ggplot2, statistical modeling, and interactive Shiny web applications.
Data Wrangling & EDA
Master dplyr, tidyr & ggplot2
Interactive Web Apps
Deploy Live Shiny Dashboards
Statistical & Predictive Models
Regression, ANOVA & Machine Learning
Get The Syllabus
Enter your details to instantly download the complete Data Analytics with R Syllabus PDF.
Complete Curriculum Roadmap
From writing simple vectors and pipes to managing big enterprise datasets, running statistical models, and publishing live Shiny applications.
R Foundations & Data Wrangling (tidyverse)
-
01
RStudio Environment & R Syntax
Variables, vectors, lists, data frames, control structures, and package management.
-
02
Data Ingestion from Multiple Sources
Import CSV, Excel, SQL databases (DBI), Google Sheets, and REST API data feeds.
-
03
Data Cleaning & Transformation (dplyr & tidyr)
Filter, select, mutate, summarize, pivot wider/longer, handle missing values and dates.
Exploratory Data Analysis & Visualization (ggplot2)
-
04
Grammar of Graphics with ggplot2
Aesthetics, geoms, coordinate systems, scales, color accessibility, and theme styling.
-
05
Advanced Visual Storytelling
Faceted plots, distribution density, correlation heatmaps, boxplots, and time trends.
-
06
Detecting Outliers & Data Profiling
Using skimr, IQR rules, z-scores, and automated data quality audits.
Statistical Modeling & Business Forecasting
-
07
Hypothesis Testing & Statistical Inference
p-values, Confidence Intervals, paired/two-sample t-tests, Chi-square tests, and ANOVA.
-
08
Linear & Logistic Regression Analysis
Multiple regression, residual diagnostics, odds ratios, binary classification, and AUC/ROC.
-
09
Time-Series Forecasting & Business Trends
Seasonality decomposition, moving averages, ARIMA forecasting, and revenue projections.
Interactive Shiny Apps & Capstone Deployment
-
10
Live Interactive Dashboards with R Shiny
UI/Server reactive architecture, reactive inputs, drill-down tables, and automated KPIs.
-
11
Executive Reporting with Quarto & Markdown
Create automated PDF/HTML reports combining live code, charts, and executive narrative.
-
12
End-to-End Enterprise Capstone Project
Solve a real-world enterprise analytics challenge and publish code to your GitHub portfolio.
Need the complete module-by-module breakdown?
Inquire now to receive the comprehensive course curriculum, project guidelines, and dataset list.
Why Learn Data Analytics in R?
Discover how mastering R programming empowers you to handle massive datasets, perform rigorous statistical analysis, and build automated reporting systems.
Process Millions of Rows Smoothly
Break the million-row limits of Excel. Learn tidyverse and data.table to import, join, clean, and aggregate huge corporate datasets in seconds.
Interactive Shiny Web Apps
Build and deploy fully interactive web apps with R Shiny. Empower business users with self-service filters, drill-downs, and dynamic charts without license fees.
Publication-Grade Visualizations
Master ggplot2's grammar of graphics to build stunning custom charts, multi-panel facets, distribution density curves, and interactive plotly graphs.
Statistical & Predictive Power
Apply real hypothesis tests (t-tests, ANOVA, Chi-Square), build linear & logistic regression models, and forecast business trends with confidence.
Automated Reproducible Reporting
Say goodbye to copy-pasting tables into PowerPoint every month. Use Quarto to automatically regenerate updated executive PDF/HTML reports with one click.
Career-Ready GitHub Portfolio
Build real corporate capstone projects, document your analysis with clean R code, and create a verifiable GitHub portfolio that recruiters value.
Tools & Packages You Will Master
Learn the exact data science packages used by world-class Business & Data Analytics teams to clean data, run models, and publish dashboards.
RStudio / Posit
Primary IDEInteractive coding environment for running scripts, debugging pipelines, managing enterprise projects, and connecting to databases.
tidyverse & dplyr
Data ManipulationThe industry gold standard for piping, filtering cohorts, grouping metrics, merging datasets with SQL-like joins, and data wrangling.
ggplot2 & plotly
Visual StorytellingBuild publication-quality charts, multi-variable scatter matrices, distribution facets, and convert static plots into interactive web visuals.
R Shiny
Interactive Web AppsBuild and host live enterprise web dashboards with dynamic sliders, dropdown filters, reactive tables, and automated calculations.
caret & broom
Statistical ModelingTrain linear & logistic regression algorithms, run hypothesis tests, diagnostic residuals, and evaluate model performance.
lubridate & stringr
Data CleaningEasily manipulate complex date-time objects, parse timestamps, clean messy text strings, and standardize customer records.
flexdashboard
Executive KPI ViewsCreate clean, responsive grid-based dashboard scorecards featuring KPI value boxes, gauges, and categorized navigation tabs.
Quarto & Git
Reports & PortfolioAutomate reproducible PDF/HTML executive briefings and publish your complete portfolio of data analytics projects directly to GitHub.
100% Free & Open-Source Stack
Every tool and library in this program is completely open-source and ready for commercial enterprise deployment without software licenses.
Is This Program Right For You?
Designed for anyone seeking to master real computational data analysis, statistical modeling, and interactive reporting using R.
Excel Users & MIS Reporting Professionals
Break through spreadsheet limitations. Automate repetitive reports and process large multi-million row datasets effortlessly without software freezes.
Business, Marketing & Financial Analysts
Upgrade from simple descriptive summaries to predictive regression models, revenue forecasting, customer segmentation, and live Shiny apps.
Graduates, MBAs & Career Switchers
Enter the high-growth Data Analytics and Data Science domain with practical project experience and an impressive GitHub code repository.
Researchers & Academic Scholars
Conduct rigorous hypothesis testing, run ANOVA/Chi-Square evaluations, and output publication-grade charts ready for peer-reviewed journals.
Program Prerequisites
Everything you need before your first day of class.
-
Basic Mathematical & Logical Thinking
Comfort with everyday percentages, averages, and basic arithmetic concepts.
-
Familiarity with Spreadsheets
Understanding of rows, columns, and viewing tabular data in Excel or Google Sheets.
-
A Standard Laptop & Internet
Any basic Windows, Mac, or Linux computer capable of running RStudio Desktop or Posit Cloud.
Zero Coding Background Needed: You will be guided from basic syntax and keyboard shortcuts to building complex statistical models step-by-step.
Meet Your Master Instructor
Learn directly from an experienced Data Science & Business Intelligence practitioner with over a decade of corporate analytics delivery.

Mohammad Kashif
Principal Data Science & Analytics Consultant
Bridging Raw Code with High-Impact Business Decisions
Mohammad Kashif is a veteran data consultant and corporate mentor with over 12 years of hands-on experience solving complex business problems using R, statistical modeling, and data pipelines. He has trained thousands of working professionals across retail, banking, IT, and consulting.
His teaching pedagogy focuses strictly on **100% practical implementation** — taking messy raw real-world data, building reproducible analytical models, and deploying live Shiny web dashboards that drive genuine enterprise ROI.
Years Experience
Professionals Trained
Hands-On Labs
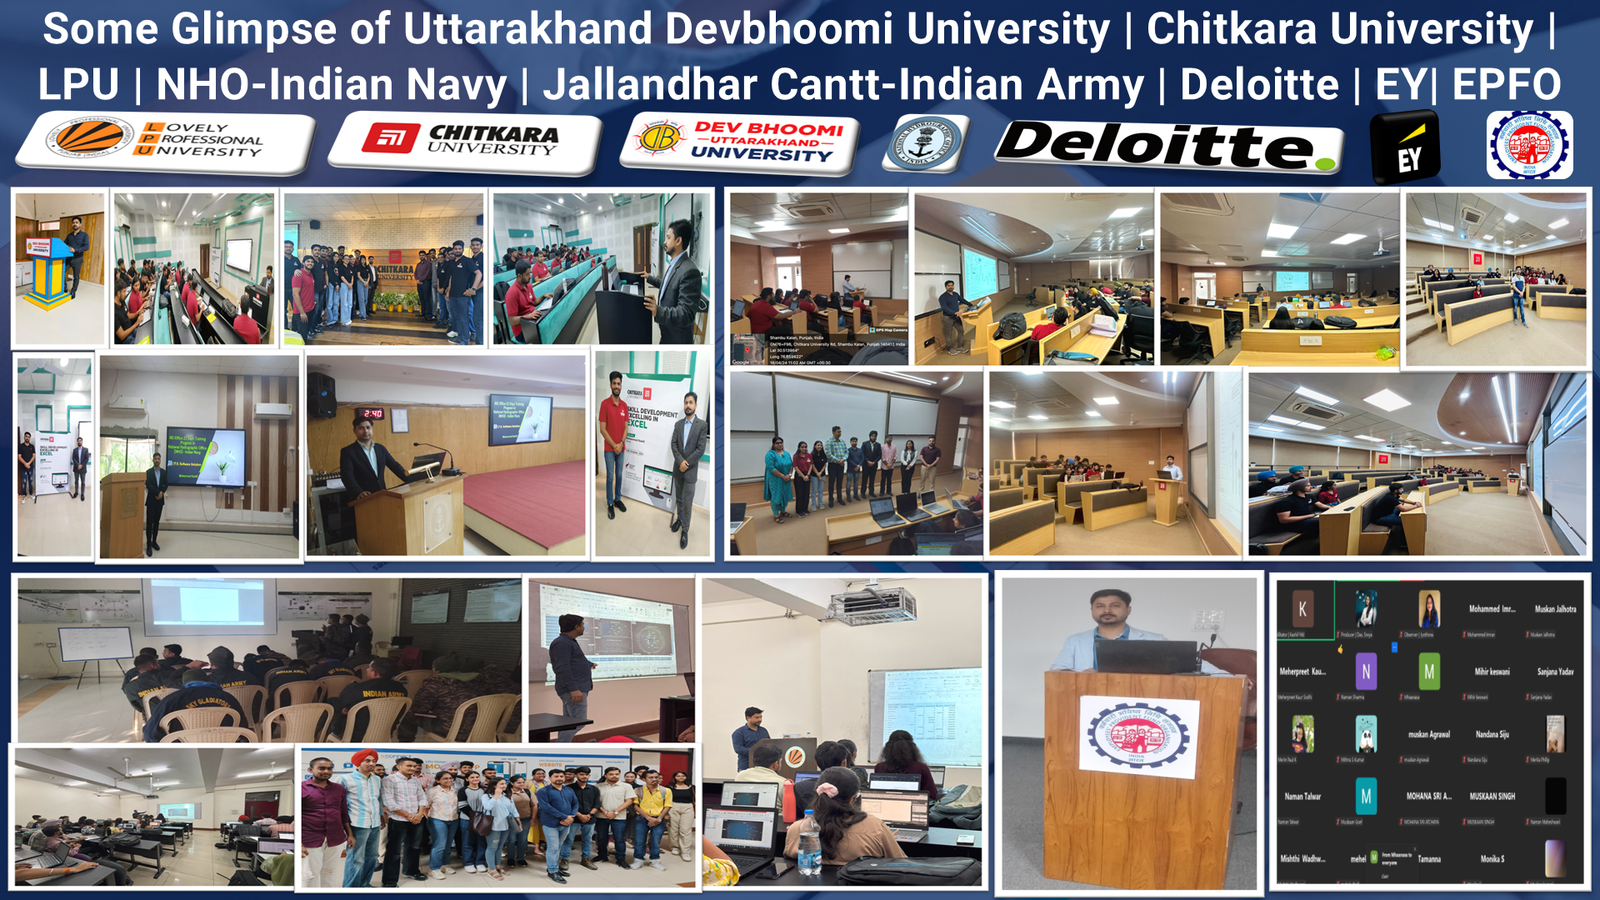
Trusted By Top Institutions & Corporations
Delivering high-impact Data Analytics, Business Intelligence, and Data Science training to India's premier Universities, Armed Forces, and leading enterprises.
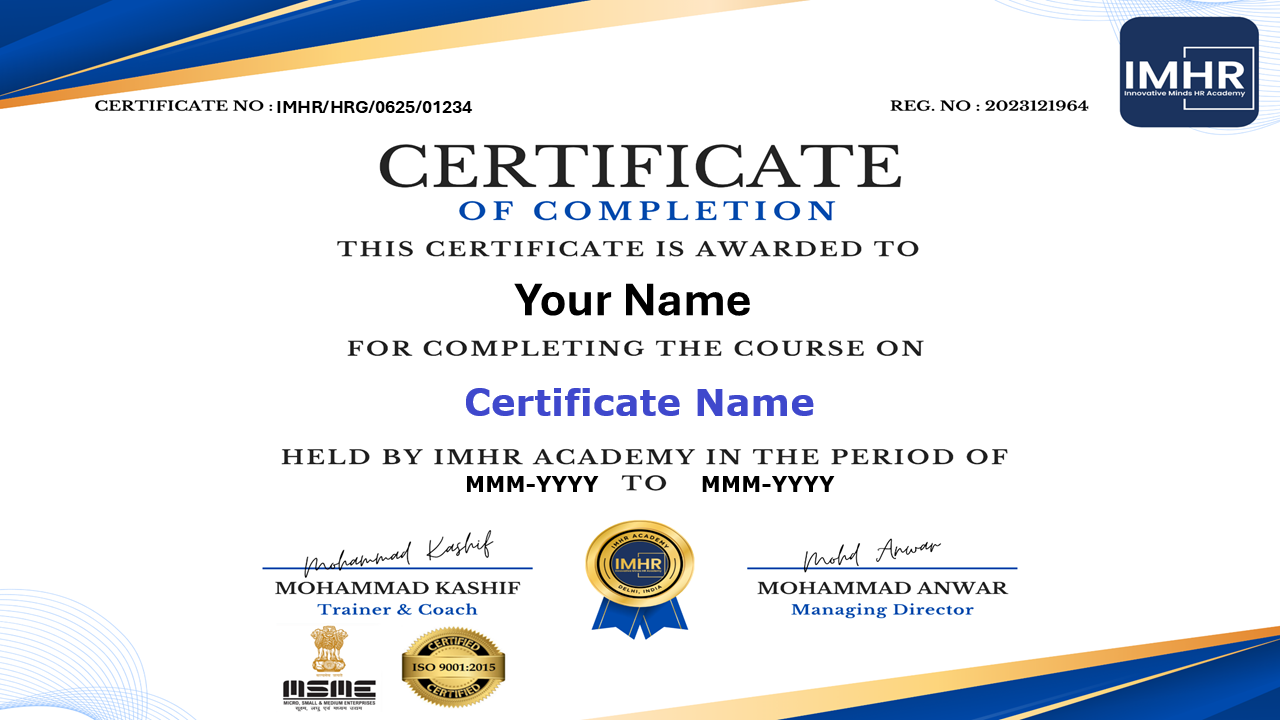
Earn Your Industry-Recognized Data Analytics Certificate
Validate your computational R programming, data wrangling, and Shiny dashboard expertise with an employer-trusted credential.
Demonstrate Real Proof of Analytics Competence
This credential is awarded upon successful completion of hands-on data lab assignments and the end-to-end Capstone Project. It provides hiring managers verifiable proof that you can clean messy data, conduct hypothesis testing, and deploy live data apps in R.
-
LinkedIn 1-Click Shareable
Add your verifiable credential directly to your LinkedIn profile under "Licenses & Certifications" to attract recruiters.
-
QR Code & Unique Verification ID
Recruiters and corporate employers can instantly verify the authenticity of your certificate online anytime.
-
Validated by Real Corporate Projects
Proves your capability to wrangle data with dplyr, create visualizations with ggplot2, and build Shiny web dashboards.
Learners Who Scaled Their Analytics Careers
Read how our graduates broke Excel limitations, automated reporting pipelines, and landed high-paying data roles.
"I was constantly frustrated with Excel crashing on 800k rows. Learning dplyr and data.table in R completely freed me. Now I process 5 million transaction rows in seconds. Phenomenal course!"
Aditya Roy
Senior Financial Analyst
"Building a live sales and inventory app with R Shiny was the highlight of this training. My manager was stunned that I could deploy a full interactive dashboard without a front-end developer."
Megha Sen
Supply Chain Specialist
"ggplot2 changed the way our leadership views our reports. The faceted distribution charts and correlation heatmaps made our quarterly presentations 10x more impactful."
Vikram Joshi
Business Operations Lead
"The Capstone project helped me land my current role as a Junior Data Analyst. Having a clean GitHub repo with reproducible Quarto reports gave me a huge edge in the technical interview."
Shreya Bhatt
Data Analyst, E-Commerce
"I was constantly frustrated with Excel crashing on 800k rows. Learning dplyr and data.table in R completely freed me. Now I process 5 million transaction rows in seconds. Phenomenal course!"
Aditya Roy
Senior Financial Analyst
"Building a live sales and inventory app with R Shiny was the highlight of this training. My manager was stunned that I could deploy a full interactive dashboard without a front-end developer."
Megha Sen
Supply Chain Specialist
Enroll in Data Analytics with R
Master data wrangling, ggplot2 visual storytelling, predictive modeling, and live Shiny apps.
Everything Included in Your Enrollment:
- Complete 16-Week Curriculum (70+ Hours of Practical Labs)
- Hands-on Projects: tidyverse, ggplot2, Shiny & caret
- Real Business Datasets (E-Commerce, Finance, Healthcare)
- End-to-End Enterprise Capstone & Verifiable Certificate
- Weekly Live Doubt Clearing & Trainer Support Group Access
🎁 Bonus: Production-Ready R Shiny & Quarto Portfolio Templates
₹14,999
One-Time Complete Course Fee
Frequently Asked Questions
Everything you need to know about learning practical Data Analytics and Shiny applications in R.
Why should I learn R for Data Analytics instead of Python or Excel?
tidyverse ecosystem makes data wrangling feel intuitive and readable. Moreover, ggplot2 produces unmatched publication-grade charts, and Shiny allows you to create full-stack interactive web dashboards in pure R without writing HTML, CSS, or JavaScript.
I have never written code before. Can I still join this program?
What kind of datasets and real-world projects will we work on?
What will I build during the final Capstone Project?
Do I get class recordings and trainer support?
Ready to Become a Certified Data Analyst?
Stop struggling with spreadsheets that freeze. Master tidyverse, build predictive regression models, and launch interactive Shiny web applications in just 16 weeks.

